

You’ve probably heard about BMI before, but the standard index doesn’t always work for everyone, especially if you’re from a different background. The Asian BMI chart uses different numbers because research shows health risks can appear at lower body weights in these populations.
Check your BMI with our calculator 👉
In this article, we’ll walk through what this chart looks like and why it matters for your health. Think of this as your friendly guide to understanding where you fall on the scale and what that means for your wellness.
The World Health Organization created these adjusted cut points back in 2002 after reviewing data from various countries. Instead of starting at 25 for overweight, the Asian chart bumps that down to 23. This change reflects the point at which metabolic risks begin to rise.
This isn’t about making anyone feel bad about their weight; it’s about having the right tool to better understand your body. By the end of this article, you’ll know how to calculate your BMI and what your number means for your overall health.
Understanding BMI: What It Is and Why It Matters
Let’s dive into the basics of BMI and see why it’s important. BMI stands for Body Mass Index. It’s a quick math formula that uses your height and weight to estimate body fatness. This index helps us understand where we stand in terms of health.
The calculation is pretty straightforward. You take your weight in kilograms and divide it by your height in meters squared. For example, if you weigh 70 kg and are 1.70 m tall, you would calculate your BMI like this: 70 ÷ (1.70 × 1.70) = 24.2.
If math isn’t your thing, don’t worry! There are plenty of online calculators that’ll do the work for you in seconds.
What’s cool about BMI is that it gives you a starting point. It provides a general idea of whether your weight might be affecting your health.
Doctors and public health researchers love using this tool because it’s cheap, fast, and doesn’t require any fancy equipment.
Across large groups of people, BMI does a decent job of predicting who might be at higher risk of conditions like diabetes and heart disease. However, it isn’t perfect and has some blind spots you should know about.
For instance, BMI can’t tell the difference between muscle and fat. So, a really fit person might have a high BMI reading that doesn’t reflect their actual health. It also doesn’t show where your body stores fat. We know that belly fat is more concerning than fat stored elsewhere.
Some studies have shown that two people with the exact same BMI can have totally different body compositions and health profiles. Think of BMI as a screening tool, not a final diagnosis. It’s the first clue that might prompt a deeper look, not the whole story.
The key is using BMI alongside other measures, like waist circumference and blood work, to get the full picture. Below is a summary of how BMI works:
| Measurement | Formula | Example |
|---|---|---|
| Weight | in kilograms | 70 kg |
| Height | in meters | 1.70 m |
| BMI Calculation | Weight ÷ (Height × Height) | 70 ÷ (1.70 × 1.70) = 24.2 |

What Makes the Asian BMI Chart Different
The Asian BMI guidelines differ significantly from the standard metrics used in many Western countries. This distinction arises from the fact that the traditional BMI chart was primarily developed using data from European and Caucasian populations. Consequently, those numbers do not always apply to everyone.
Research indicates that Asian bodies tend to carry fat differently. Health issues can begin to emerge at lower weights than what the standard chart suggests.
For instance, studies show that for the same amount of body fat, individuals of Asian descent typically have a BMI that is about 2 to 3 points lower than their Caucasian counterparts. This difference is crucial for understanding health risks.
In 2002, a panel from the World Health Organization reviewed various studies and concluded that the BMI cut points needed adjustment for Asian populations.
They determined that a BMI of 23 to 27.5 kg/m² should be categorized as overweight, while a BMI of 27.5 kg/m² or higher is considered obese. In contrast, the standard cut points are 25 to 29.9 for overweight and 30 or above for obesity.
Check your BMI with our calculator 👉
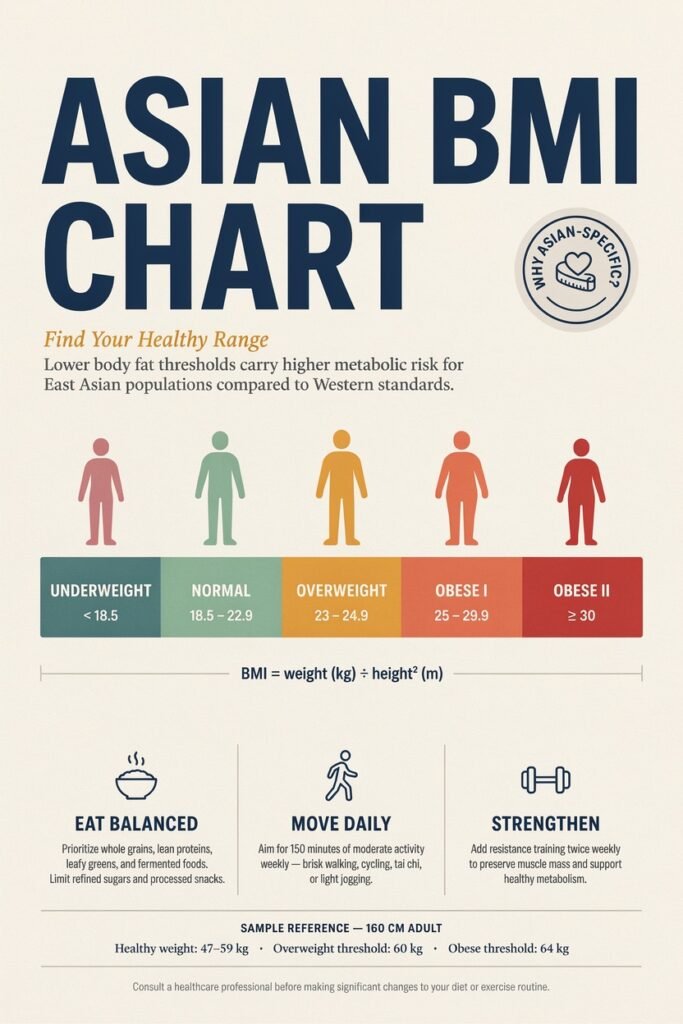
It’s important to note that Asian Americans have lower rates of overweight and obesity when using the standard BMI cut points. However, they still face a disproportionate burden of type 2 diabetes. This discrepancy highlights the need for a more tailored approach to health metrics.
- The standard BMI chart was built mostly using data from European and Caucasian populations, and it turns out those numbers don’t translate perfectly to everyone.
- Asian bodies tend to carry fat differently, and research shows that health problems can start creeping in at lower weights than the standard chart suggests.
- For the same amount of body fat, Asians typically have a BMI that’s about 2 to 3 points lower than White folks, which is a bigger gap than most people realize.
- This isn’t about one group being healthier or unhealthier; it’s about differences in body composition that affect how BMI numbers should be interpreted.
- Back in 2002, the World Health Organization convened experts who reviewed data from Asian countries and determined that different cut points were necessary.
- The expert consultation found that metabolic risks such as insulin resistance and high blood pressure appear at BMIs that the standard chart still classifies as normal.
- So the Asian BMI chart shifts everything down: normal weight tops out at 22.9 instead of 24.9, and overweight starts at just 23.
- What the standard chart calls a healthy BMI of 23 or 24 might actually be a warning zone for someone of Asian descent.
- Studies of Asian Americans in California found that diabetes rates were higher even at BMIs between 23 and 24.9, which the old chart would have labeled as ” perfectly fine.
- This adjusted chart isn’t about being stricter for no reason; it’s about catching risks earlier when they’re easier to manage.
- Different Asian ethnic groups also show variations; for example, Filipinos tend to have higher average BMIs while Vietnamese populations often show lower averages.
- Public health guidelines are slowly catching up to this research, but not all doctors in Western countries routinely use the Asian-specific cut points yet.
| Standard BMI Cut Points | Asian BMI Cut Points |
|---|---|
| Normal Weight: 18.5 – 24.9 | Normal Weight: 18.5 – 22.9 |
| Overweight: 25 – 29.9 | Overweight: 23 – 27.5 |
| Obese: 30+ | Obese: 27.5+ |
How to Calculate Your BMI and Find Your Category
Calculating your BMI can be straightforward, and it’s a handy tool for gauging your health. Let’s walk through the steps together, just like I would show a friend.
Simple Formula and Example Calculation
The formula for BMI is simple: weight (kg) ÷ height (m)². To illustrate, if you weigh 70 kg and are 1.70 m tall, you would calculate your BMI as follows:
First, square your height: 1.70 × 1.70 = 2.89. Then, divide your weight by that number: 70 ÷ 2.89 = 24.2. This means your BMI is 24.2.
Now, on the standard chart, a BMI of 24.2 is considered normal weight. However, according to the Asian BMI guidelines, this actually falls into the overweight category, starting at 23.
Using Online BMI Calculators Designed for Asians
If math isn’t your strong suit, don’t worry! There are plenty of free online calculators that can help you find your BMI in seconds. Just make sure to look for calculators that specifically mention Asian BMI guidelines, as they will use the appropriate cut points for your health.
Here’s a quick guide to calculating your BMI:
- Grab your weight in kilograms. If you only know the number in pounds, divide it by 2.2 to convert it.
- Measure your height in meters. If you’re using inches, multiply by 0.0254 to convert to meters, or use centimeters and divide by 100.
- Now, take your weight and divide it by your height squared. For example, if you weigh 70 kg and stand 1.70 m tall, you’d do 70 divided by 2.89, which gives you 24.2.
- Remember, this tool is not for everyone. If you’re pregnant, very muscular, elderly, or under 18, the numbers may not be as meaningful.
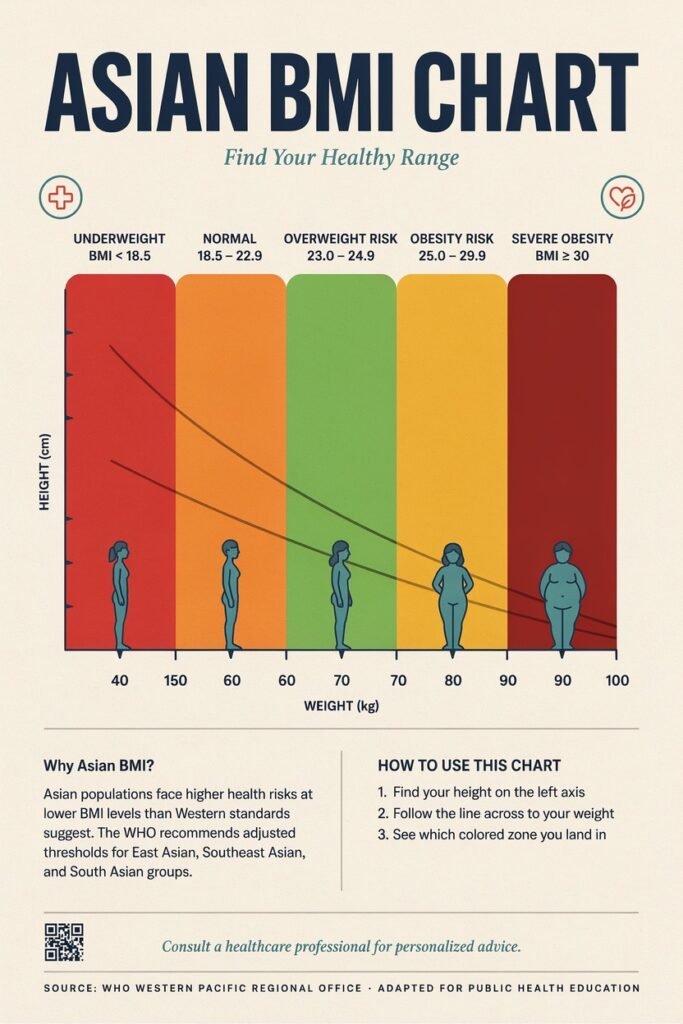
- After you calculate your BMI, compare it to the Asian BMI categories: under 18.5 is underweight, 18.5 to 22.9 is normal, 23 to 27.5 is overweight, and above 27.5 is obese.
- Keep track of your number by writing it down or saving it in a note on your phone. This way, you can monitor changes over time without stressing over a single number.
For more personalized advice, consider consulting a healthcare provider or an accredited dietitian. They can provide insights tailored to your specific health needs. Remember, BMI is just one piece of the puzzle when it comes to understanding your health.
The Asian BMI Chart: Finding Your Healthy Range
Understanding your weight categories can be a key step in managing your health effectively. The Asian BMI chart simplifies this process into clear categories, helping you grasp what each one means for your overall wellness.
Understanding the BMI Categories for Asian Adults
The Asian BMI categories provide a framework to assess your weight and its potential health implications. Here’s a breakdown of what these categories signify:
- Underweight: A BMI of less than 18.5 kg/m². While some may admire thinness, being underweight can lead to health risks too.
- Normal range: A BMI between 18.5 and 22.9 kg/m². This range is often where health risks are lowest for adults.
- Overweight: This category ranges from a BMI of 23.0 to 27.5 kg/m². Here, doctors pay closer attention to potential health concerns.
- Obese Class I: A BMI from 25.0 to 29.9 kg/m². This indicates a higher risk for health issues.
- Obese Class II: A BMI of 30 kg/m² and above. This category reflects significant health risks.
What “Normal,” “Overweight,” and “Obese” Mean Here
It’s essential to recognize that these categories aren’t labels; they are simply reference points to help predict health issues. For instance:
- A BMI of 23 to 24.9 is considered normal on the standard chart but is flagged as at risk on the Asian chart.
- Obesity starts at a lower BMI of 27.5 in the Asian guidelines compared to the standard cutoff of 30.
- In countries like Japan and Singapore, these lower cut points have been in use for years due to clear evidence of health impacts.
Remember, the normal range isn’t a guarantee of good health, and being above it doesn’t automatically mean you’ll face problems. It’s about understanding trends over time. If your BMI is gradually increasing, that’s worth noting, even if you’re still in the normal range.
Think of these categories as gentle signposts on your health journey, not as final destinations or definitions of who you are. By understanding these categories, you can take proactive steps toward a healthier lifestyle.
Why the Asian BMI Chart Matters for Your Health
Understanding the significance of the Asian BMI chart is essential for your health journey. It’s not just about numbers; it’s about how those numbers relate to your well-being. This chart is crucial because it reflects patterns of health risks that may vary with body composition.
Check your BMI with our calculator 👉
One of the most pressing connections is between BMI and diabetes risk. Research shows that type 2 diabetes can develop at lower BMIs in Asian populations compared to other groups. A significant study from California examined over 45,000 respondents and revealed some eye-opening findings.
For instance, Vietnamese, Korean, Filipino, and South Asian adults with BMIs between 23 and 24.9 kg/m² had higher diabetes rates than non-Hispanic Whites with the same BMI. This range, typically considered normal, highlights a metabolic difference in how Asian bodies process fat and manage blood sugar levels.
Filipinos, in particular, had the highest prevalence of type 2 diabetes at 12.7%. This statistic is higher than that of other groups, including African Americans and Hispanics. The trend continues with heart disease, where risks appear at lower BMIs than the standard chart would suggest.
Hypertension is another concern. Research indicates that high blood pressure is more common among Asian adults at lower BMIs, especially within Filipino populations. This correlation seems tied to how body fat is distributed, with a tendency for more visceral fat around the organs, even when total body weight appears normal.
Metabolic syndrome, which includes high blood sugar and abnormal cholesterol levels, can emerge at BMIs as low as 23 in Asian adults. This doesn’t mean you should panic if your BMI is 23; rather, it emphasizes the importance of having informed discussions with your healthcare provider.
The Asian BMI chart serves as a proactive tool, helping to identify risks earlier. By understanding these connections, you can take steps toward healthier living and potentially prevent more severe health issues down the line.
| Health Condition | Risk at Lower BMI | Population Affected |
|---|---|---|
| Type 2 Diabetes | Higher prevalence at BMI 23-24.9 | Vietnamese, Koreans, Filipinos, South Asians |
| Heart Disease | Increased risk at lower BMIs | Asian Americans |
| Hypertension | More common at BMI 23-24.9 | Filipinos |
| Metabolic Syndrome | Can develop at BMI 23 | Asian Adults |
Using the Asian BMI Chart as a Screening Tool
Using the Asian BMI guidelines can be a smart way to monitor your health. This framework acts as an early warning system, helping you identify potential health risks before they become serious. It’s essential to remember that these guidelines are not a definitive prediction of your health but rather a helpful tool for understanding where you might stand.
Some groups should pay extra attention to where they fall on the Asian BMI scale. Research indicates that certain populations, like Filipino Americans, have the highest rates of overweight and obesity, with nearly 79% falling into these categories. Similarly, over half of South Asians, Koreans, Japanese, and Chinese Americans meet the criteria for overweight or obesity.
Who Should Pay Extra Attention
If you have a family history of diabetes or heart disease, your BMI number deserves even more attention, regardless of where you fall on the scale. Women of Asian descent may experience metabolic changes at lower BMIs than men, making gender an important factor in interpretation.
For instance, Japanese Americans showed elevated diabetes risk at BMIs between 27.5 and 29.9, a range that the standard guidelines would label as merely overweight. This highlights the need for a nuanced understanding of these metrics.
Interpreting Your BMI Results in Context
The Asian BMI cut points are designed to be more sensitive for catching potential health issues. This means they are better at identifying individuals who may need help. However, this increased sensitivity can lead to some people being flagged as at risk, even if they may not develop health issues later on. And that’s okay!
Your BMI number is most meaningful when you consider it alongside other health metrics, such as waist measurement, blood pressure, blood sugar, and cholesterol levels. Don’t let a single number send you spiraling; instead, use it as motivation to engage in a constructive conversation with your healthcare provider.
In conclusion, think of the Asian BMI guidelines as a valuable resource in your health journey. They can guide you in making informed decisions about your well-being without causing unnecessary anxiety.
When to Consult a Healthcare Provider
Knowing when to reach out to a healthcare provider can be crucial for your well-being. It’s essential to recognize signs that go beyond just checking your BMI. These indicators can help you determine if it’s time for a more in-depth health evaluation.
Signs That Go Beyond the BMI Number
There are some clear signs that it’s time to move beyond just checking your BMI and actually sit down with a healthcare provider:
- If your BMI is 23 or above and you have other risk factors like a family history of diabetes, that’s a good reason to schedule a visit.
- Rapid weight gain over a short period is worth bringing up with your doctor, even if your BMI hasn’t crossed into the overweight category yet.
- Pay attention to things like feeling extra tired, being thirstier than usual, or noticing changes in your vision; these can be subtle signs of blood sugar issues.
- High blood pressure readings at the pharmacy or at home are another clue that your body might be under more strain than your BMI suggests.
- If you’ve had blood work that showed elevated cholesterol or signs of fatty liver, those are red flags that deserve follow-up regardless of your weight.
What Your Doctor Might Look For Next
When you do see a doctor, they’ll probably want to check more than just your weight and height. Expect them to order blood tests that measure your fasting glucose and HbA1c, which give a much clearer view of your diabetes risk than BMI ever could.
Your doctor might also check your lipid profile and liver enzymes since these can be early warning signs of metabolic trouble. They’ll likely measure your blood pressure and maybe your waist circumference too, since belly fat is a bigger concern than fat elsewhere.
Don’t feel awkward bringing up the Asian BMI guidelines if your doctor doesn’t mention it; some providers still default to the standard chart. The goal of these visits isn’t to get lectured about your weight; it’s to catch potential problems early when they’re easiest to address.
Common Questions About the Asian BMI Chart
Questions and misconceptions about the Asian BMI guidelines are frequent, so let’s set the record straight. Many people wonder if the adjusted cut points were created to label more individuals as overweight. The truth is, these adjustments stem from decades of research that highlighted real metabolic differences in body composition.
Another common query is whether these guidelines apply uniformly to all Asian populations. While the chart serves as a general guide, individual variations do exist. It’s important to recognize that your BMI number does not define you. It’s just one snapshot among many that contribute to a fuller health picture.
Addressing Myths and Misunderstandings
If you’re athletic and muscular, your BMI might be high, even if you’re in excellent shape. This scenario illustrates the limitations of the tool. Conversely, someone with a normal BMI could still have high visceral fat around their organs, which poses a greater metabolic risk than fat located under the skin.
Understanding body fat percentage and fat distribution is crucial. These factors can provide more accurate insights into metabolic risks than BMI alone. Research continues to evolve, and what we know about Asian American health today is far more nuanced than what was understood two decades ago.
Why BMI Is Just One Piece of the Puzzle
The Asian BMI guidelines are not meant to replace other health measures; rather, they complement them as part of a broader toolkit. Some individuals may wonder if they should use the Asian chart if they are of mixed race. That’s a great question for your doctor, as individual assessment is key.
Ultimately, BMI serves as a starting point for conversation, not the final word on your health or your worth. For more personalized advice, consider using resources like a BMI calculator designed for Asian populations. This can help you better understand your health in context.
Taking Control: Steps to Maintain a Healthy BMI Range
Making small, manageable changes can significantly impact your health journey. Maintaining a healthy weight is crucial for reducing the risk of diseases like diabetes and heart disease. The ideal weight range for adults is between 18.5 and 22.9 kg/m². Here are some simple lifestyle tips to help you stay on track.
Simple Lifestyle Tips That Make a Difference
Keeping your BMI in a healthy range doesn’t have to mean drastic diets or punishing workout routines. Instead, focus on small, consistent changes that add up over time.
- Start with food swaps that feel natural, like choosing brown rice instead of white or adding an extra serving of vegetables to meals you already make.
- Movement matters, but it doesn’t have to be intense. A daily walk after dinner or taking the stairs instead of the elevator counts more than you’d think.
- Sleep is an underrated piece of the puzzle. When you’re short on sleep, your body produces more stress hormones that can drive weight gain.
- Stress management plays a real role, too. Chronic stress can mess with your blood sugar and make it harder to maintain a healthy weight.
- Drinking water throughout the day and cutting back on sugary drinks is one of the simplest ways to reduce empty calories without feeling deprived.
Tracking Progress Without Obsession
When it comes to tracking progress, checking your BMI once a month is plenty. Daily weigh-ins can drive you crazy, and don’t show the full trend. Pay attention to how your clothes fit and how your energy levels feel; those are often better indicators than any single number.
If you’re making healthy changes and your BMI isn’t budging, don’t assume you’re failing. Your body composition might be improving even if the scale stays put. Building muscle through strength training can actually raise your BMI while making you healthier, which is why context always matters.
The goal isn’t perfection; it’s about feeling good and keeping your metabolic health on track. Celebrate the small wins along the way. Every healthy meal and every walk is a step in the right direction for your long-term well-being.
| Healthy Habits | Benefits |
|---|---|
| Food Swaps | Reduces calorie intake and improves nutrition |
| Regular Movement | Boosts metabolism and improves mood |
| Quality Sleep | Regulates hormones and aids weight management |
| Stress Management | Helps maintain healthy blood sugar levels |
| Hydration | Reduces cravings and supports overall health |
Moving Forward: Making the Asian BMI Chart Work for You
Now that you’ve explored the details of the Asian BMI guidelines, it’s time to think about how this knowledge can empower your health journey. Understanding these adjusted cut points offers a clearer picture of health risks for Asian Americans, especially for populations like Filipinos, who are often at higher risk for obesity and type 2 diabetes.
The goal of these guidelines is to promote awareness and encourage proactive health management. Remember, knowing your BMI using the right metrics is a form of self-care, not self-criticism. These numbers are tools to help you engage in meaningful conversations with your healthcare provider.
As research continues to evolve, stay informed about how these metrics can impact your health. Your journey is unique, and the Asian BMI framework is just one resource among many. Keep focusing on the bigger picture: your energy levels, lab results, and overall well-being matter just as much as any number.
Thank you for taking the time to learn about this important topic. Your body and future self will appreciate your attention to these details now.