
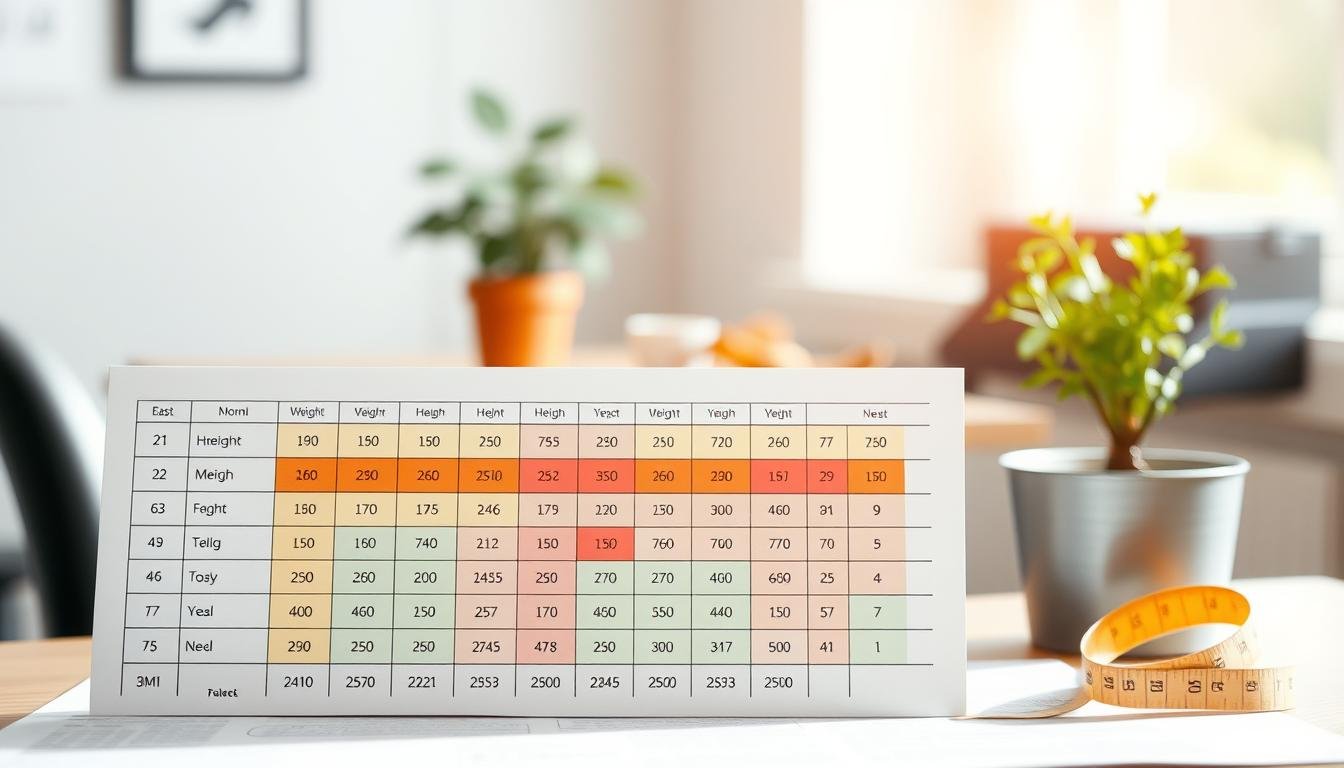
You’ve probably heard the term BMI tossed around during doctor visits or from that one friend who tracks everything about their health. It stands for body mass index, and honestly, it’s just a simple way to see where your weight sits compared to your height.
Check your BMI with our calculator 👉
A lot of folks find that having a handy BMI chart makes the whole process feel less clinical and more like a personal tool. Think of it as a snapshot of your health, not the entire story, but a really useful snapshot that helps you see patterns over time.
This guide will walk you through what BMI actually means, how to read the chart without getting confused, and why tracking it might be worth your time. Whether you’re 25 years old or 55 years old, understanding your body and what the numbers say can be a game changer for your health journey.
The chart we’re discussing is designed for adults aged 20 years and older. Kids and teens have their own charts that factor in age and growth patterns, so this one’s specifically for the grown-ups in the room. You’ll see how easy it is to find your spot on the chart and what that spot might mean for your overall health picture.
No complicated math is required, just your height, your weight, and a willingness to pay a little more attention to your body.
Key Takeaways
- BMI is a simple way to track your weight in relation to your height.
- Having a BMI chart can make tracking your health feel more personal.
- This guide simplifies how to read and understand BMI.
- Understanding your BMI can be beneficial for your health journey.
- The chart is tailored for adults aged 20 and older.
- No math skills are needed—just your height and weight!
What Exactly Is Printable BMI Chart and Why Should You Care?
Check your BMI with our calculator 👉
Let’s take a moment to explore what BMI is and why it’s worth your attention. BMI, or body mass index, is a simple calculation that helps you understand how your weight relates to your height. It’s not just a number; it’s a tool that can guide you on your health journey.
So how do we get to that number? Well, the formula is pretty straightforward. You take your weight in kilograms and divide it by your height in meters squared. But don’t worry, you won’t need to do any of that math yourself! The handy chart does all the heavy lifting for you.
How BMI Is Calculated
Once you have your weight and height, you can find your BMI on the chart. It’s like a treasure map for your health! This number will place you into one of several categories that health professionals use to start conversations about your body and overall well-being.
Understanding BMI Categories for Adults
For adults aged 20 years and older, the categories are pretty clear-cut. They don’t change based on gender or age. Here’s a quick breakdown:
| BMI Category | BMI Range |
|---|---|
| Underweight | Less than 18.5 |
| Healthy Weight | 18.5 – 24.9 |
| Overweight | 25 – 29.9 |
| Obesity Class 1 | 30 – 34.9 |
| Obesity Class 2 | 35 – 39.9 |
| Obesity Class 3 | 40 and above |
Most people aim for a BMI between 18.5 and 24.9, which is considered the healthy weight range. If your BMI is 25 or higher, it can be a red flag indicating that your body might be carrying more fat than it needs. This extra weight can increase your risk for serious health issues like heart disease and diabetes.
Keep in mind, BMI isn’t the final word on your health. It’s a screening tool, a starting point for discussions with your doctor. They’ll look at your BMI alongside other factors like your diet, activity level, and family history to get a complete picture of your health.
In short, understanding your body mass index can be a game changer for your health journey. It’s a simple number that can lead to big changes!
How to Use Your Printable BMI Chart
Check your BMI with our calculator 👉
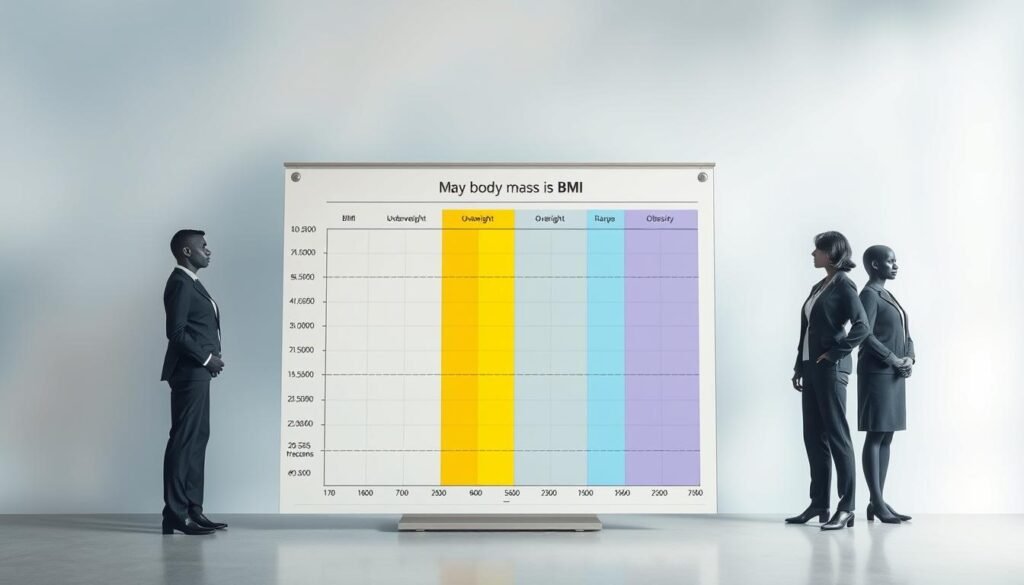
So, you’ve got your handy BMI chart ready to go! At first glance, it might look like a complicated grid, but trust me, it’s way simpler than it seems. This chart is designed to help you understand your body mass index and how it relates to your overall health.
First, locate your height along the left or top edge of the chart. Then, scan across until you find the column that matches your weight. The point where those two lines meet gives you your body mass index number. Easy, right?
Most charts use color coding to make it even clearer. Green usually means you’re in the healthy range, while yellow or orange signals that you’re overweight. If you see red, that indicates obesity. Remember, this isn’t about judgment; it’s just a way to see where you stand with your body right now.
The number you get is your mass index, which provides a ballpark idea of how much body fat you’re carrying compared to what’s generally considered healthy for your frame. For adults, this remains consistent regardless of whether you’re 30 years old or 60 years old. The categories don’t shift with age like they do for kids and teens.
Reading the Chart Right
Now, let’s talk about what those numbers actually mean for your health. If your BMI falls within the healthy range, it suggests that your weight isn’t putting extra strain on your heart, joints, and other systems. However, if your number falls into the overweight or obesity categories, it could mean your body is under more stress than it needs to be. This stress can lead to issues like high blood pressure, blood sugar problems, or joint pain over time.
But here’s the key point: BMI is a screening tool, not a diagnosis. A high number doesn’t mean you’re doomed to poor health. It’s worth discussing with your doctor to get a clearer picture. Your healthcare provider can consider your eating habits, activity level, and family history to help you understand what your BMI really means.
What the Numbers Mean for Your Health
The chart is just the first step. It opens the door to better conversations about your body and your health without making things overly complicated. If you’re curious about how to read the chart or want to explore more about BMI, you can check out more detailed information here.
Remember, understanding your body mass index is a valuable part of your health journey. It’s not just a number; it’s a starting point for taking charge of your well-being!
Making the Most of Tracking Your Body Mass Index
Tracking your body mass index can be a real game changer for your health journey. It’s not just about that one number you see on the scale. It’s about how it evolves over time and what it tells you about your body.
Here are some tips to keep your tracking simple and useful:
Tips to Keep Your Tracking Simple and Useful
- Track Over Time: The real value of tracking your weight comes from watching how it changes over months and years. A single number can be misleading, but trends tell a fuller story.
- Visibility is Key: Keep your BMI chart somewhere you’ll see it regularly. Whether it’s on the fridge, in your planner, or pinned up in the bathroom, make it part of your routine.
- Don’t Weigh Daily: You don’t need to step on the scale every day. Checking in once a week or even once a month is enough to spot trends without getting caught up in daily fluctuations.
- Record Your Progress: Jot down the date and your BMI each time you check. Over a year or two, you’ll have a clear record of your health journey.
- Focus on Patterns: Pay attention to how your BMI shifts during different life events. If it goes up during the holidays or down during stressful times, that’s useful information.
- Look Beyond the Number: Remember, your BMI is just one piece of the puzzle. How you feel, how your clothes fit, and your energy levels matter just as much.
- Aging Changes Things: As you get older, your body changes, and that’s completely normal. A 50-year-old might have a different healthy weight range than a 25-year-old, even if the categories remain the same.
When to Talk to a Professional
It’s important to know when to reach out for help. If your BMI consistently falls outside the healthy range and you’re unsure what to do, it’s a good idea to call your doctor. Also, if you’re eating well and staying active but your BMI keeps climbing, that could indicate something else going on.
Your healthcare provider can run tests, discuss your lifestyle, and help you figure out a plan that works for you. The chart is a tool, not a therapist. Use it to stay informed, but don’t let it stress you out. A quick chat with a professional can clear up a lot of confusion.
Check your BMI with our calculator 👉
Ready to Take Charge of Your Health? Grab Your Printable BMI Chart
Understanding your weight in relation to your height can feel like a puzzle, but it doesn’t have to be. Knowing your body mass index is just a number that helps you understand your body a little better. A simple chart puts that information right at your fingertips—no apps or subscriptions needed!
Whether you’re 30 years old or 70 years old, being aware of your weight and how it relates to your height is a straightforward way to keep tabs on your health over the years. The beauty of having a physical reference is that it’s always there, ready for you to check without logging into anything.
Tracking your progress over months and years gives you a sense of control that stepping on a scale alone can’t provide. Think of this as a small investment in yourself. A few minutes to check your weight can help you catch shifts early and make adjustments before they become bigger problems.
Your health deserves attention at every age. This chart is one of the simplest tools you can use to stay on top of things without feeling overwhelmed. So, print it out, stick it somewhere visible, and start using it. You might be surprised how motivating it is to see your progress laid out in black and white!