
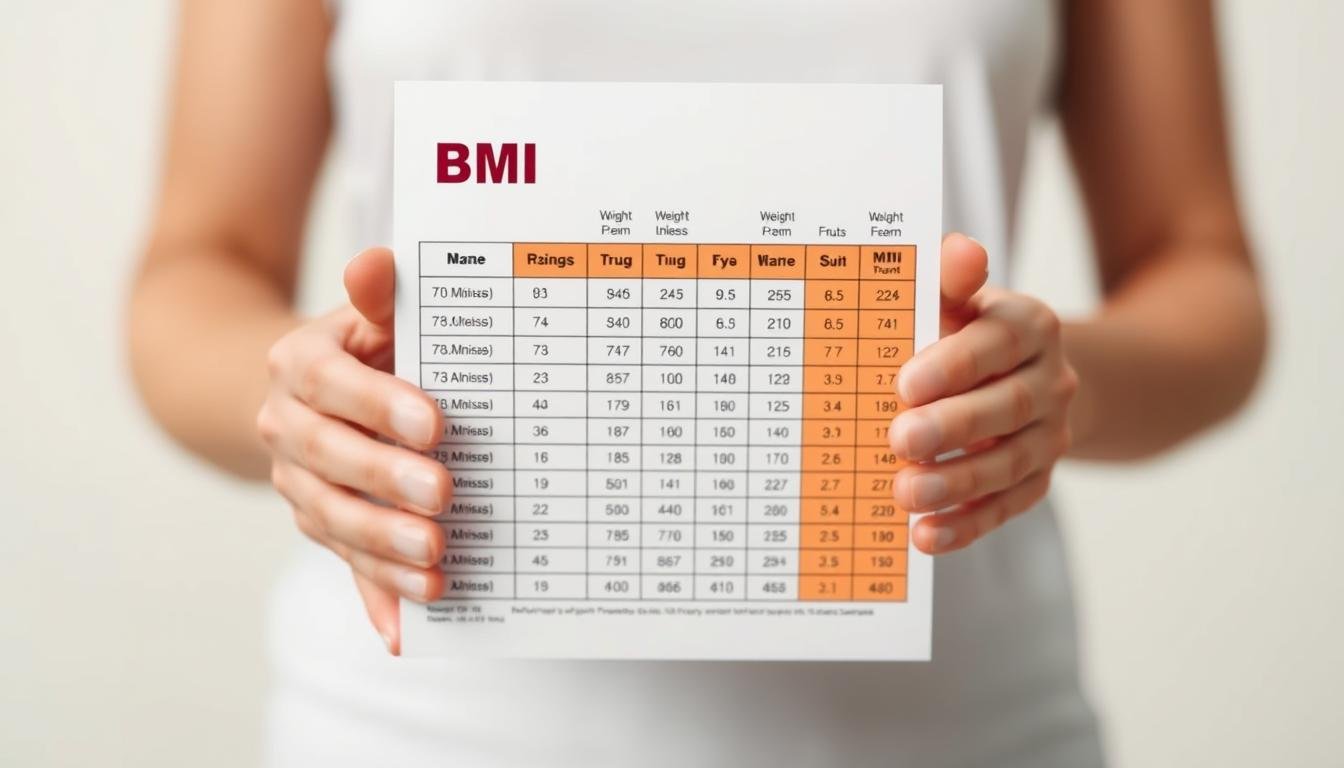
You know those times when you’re curious about your weight but don’t want to open an app or do math? That’s where having a BMI chart printable comes in handy. It’s not complicated at all; just a simple tool you can print and keep around.
Try our BMI Calculator 👉
Many adults tuck one in a desk drawer or pin it to the fridge. It takes just a moment to glance at, and you don’t need to log into anything. The beauty of a printed version is that it’s always available. No batteries, no wifi, no fuss.
Health professionals often use these charts as quick screening tools. But you don’t need a medical degree to read one. It’s basically a grid matching height and weight. Think of it as your low-tech health buddy, ready for reference before a doctor’s visit or when you’re setting personal goals.
The CDC offers adult BMI calculators online, but a printed chart gives you that instant check without staring at a screen. In this guide, we’ll walk through what BMI means, how to read the chart, and where to grab a reliable one to download and print today.
Key Takeaways
- A printable BMI chart is a quick and easy reference tool.
- It helps you check your weight without complicated apps.
- Many adults keep it handy for easy access.
- No need for technology; it’s always available.
- Health professionals use it, but it’s simple enough for anyone.
- CDC provides online calculators, but a printed chart is instant.
- This guide makes understanding BMI straightforward.
What Is BMI and Why Should You Care?
Have you ever found yourself wondering about your weight but didn’t want to fuss with an app or calculations? Well, that’s where body mass index comes in. It’s a simple number that can help you understand your weight in relation to your height.
Body mass index, or BMI, is calculated by taking your weight in kilograms and dividing it by your height in meters squared. But don’t worry; you don’t need to do the math yourself. The handy chart does all that for you!
Think of body mass as a rough snapshot of where you stand in terms of weight. It’s not the final say on your health, just a starting point for discussions with your doctor or trainer. They often use it as an indicator because it’s quick and easy to measure—just a scale and a measuring tape.
Breaking Down Body Mass Index
For adults aged 20 and older, the calculation is straightforward. The categories don’t change based on whether you’re male or female. It gives you a ballpark idea of whether your weight might be putting extra stress on your body over time.
However, it’s not perfect. A muscular person might have a high BMI but not carry much body fat. That’s why it’s just one piece of the puzzle, not the whole picture.
Why BMI Matters for Your Health
So, why should you care about this number? It can point you in the right direction regarding your weight and health. It helps you see if you’re in a healthy range or if you might need to make some changes.
Now, when it comes to children and teens, things get a bit different. Their body mass index is plotted on growth charts and turned into percentiles. This is because kids’ bodies change a lot as they grow. The same number that means one thing for an adult means something totally different for a 10-year-old.
Quick Look at BMI for Adults and Kids
The CDC provides separate calculators for adults and children. An adult BMI calculator won’t give you useful info for a child, and vice versa. Understanding these differences is crucial for interpreting results accurately.
| Category | Adults (20+ years) | Children (2-19 years) |
|---|---|---|
| Underweight | BMI | Percentile |
| Normal weight | 18.5 ≤ BMI | 5th ≤ Percentile |
| Overweight | 25 ≤ BMI | 85th ≤ Percentile |
| Obesity | BMI ≥ 30 | Percentile ≥ 95th |
At the end of the day, knowing your mass index is like having a compass. It points you in a direction but doesn’t give you the full map of your health.
Understanding BMI Categories and What They Mean for You
Ever find yourself curious about your weight but not in the mood for complex calculations? Understanding the different BMI categories can help you make sense of your health. These categories provide a clear picture of where you stand and what it might mean for your well-being.
From Underweight to Obesity: The BMI Ranges
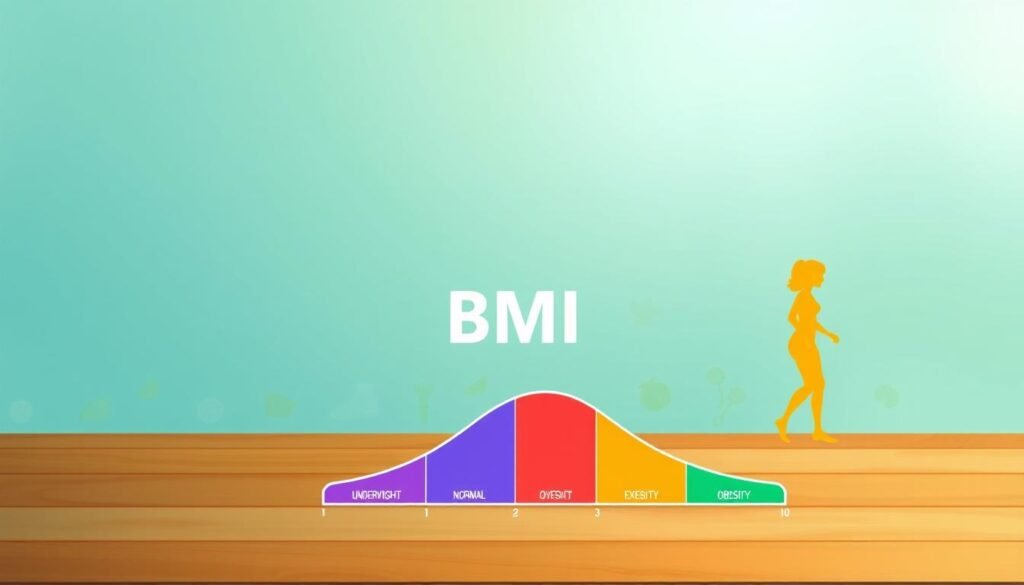
Once you’ve got your BMI number, the next step is figuring out which category it lands in. The ranges are pretty straightforward and they’re the same for all adults 20 and older:
- If your number falls below 18.5, that’s considered underweight. It might mean your body isn’t getting enough fuel to do its job properly.
- The sweet spot most people aim for is the healthy weight range, which sits between 18.5 and 24.9. This is where research shows the lowest risk for weight-related health problems.
- When you hit 25.0 to 29.9, that puts you in the overweight category. It’s a signal that body fat might be creeping up and it’s worth paying attention to.
- A BMI of 30.0 or higher falls under obesity, which gets broken down further into three classes: Class 1 (30.0 to 34.9), Class 2 (35.0 to 39.9), and Class 3 (40.0 and above).
Health Risks Linked to Different BMI Categories
These categories aren’t meant to label or shame anyone. They’re just tools that help health care providers figure out what kind of support or screenings might be helpful. The health risks tied to higher BMI categories are real but they’re not a guarantee you’ll get sick. Conditions like heart disease, type 2 diabetes, and joint problems show up more often in folks with higher numbers.
That said, a person in the overweight category who eats well and stays active might be in better shape than someone in the healthy weight range who never moves. Context matters a ton.
How Age and Gender Affect BMI Interpretation
Age plays an interesting role here. For adults, the categories don’t shift with age on paper, but older bodies often carry weight differently and muscle loss can skew things. Gender matters too, especially when you look at body composition. Women naturally carry more body fat than men at the same BMI, which is why this number is just an indicator, not a diagnosis.
For kids and teens, the whole system changes. Their BMI categories are based on percentiles that compare them to other kids of the same age and sex, so a number that looks high for an adult might be totally normal for a growing child.
If your number lands somewhere you weren’t expecting, don’t panic. It’s just information. The smart move is to chat with a health care provider who can look at the full picture.
| Category | BMI Range | Health Implications |
|---|---|---|
| Underweight | Below 18.5 | May indicate insufficient nutrition |
| Healthy Weight | 18.5 – 24.9 | Lowest risk for weight-related health issues |
| Overweight | 25.0 – 29.9 | Increased risk of health problems |
| Obesity Class 1 | 30.0 – 34.9 | Higher risk of chronic diseases |
| Obesity Class 2 | 35.0 – 39.9 | Significantly increased health risks |
| Obesity Class 3 | 40.0 and above | Severe health risks |
Using Your BMI Chart Printable: How to Download, Read, and Make It Work
Are you ready to grab a BMI chart that’s easy to use? Let’s walk through where to find one, how to read it, and the best way to print it so it lasts.
Where to Find and Download a Reliable BMI Chart Printable
The CDC website is a solid place to start. They offer free downloadable BMI chart options for adults that are straightforward and based on the standard categories we discussed earlier.
You’ll find two main versions there. One is formatted for quick screen viewing or basic desktop printing. The other is a high-resolution file you can send to a print shop if you want something really crisp.
Template.net also has customizable BMI chart templates if you want to tweak the design or add your own notes. These come in PDF format, and you can edit the layers before printing.
Tips for Reading the BMI Chart Like a Pro
When you look at any BMI chart, the layout is usually the same. Height runs along one side, weight runs along the other, and the middle grid shows the BMI numbers and color-coded categories.
To read it like a pro, find your height on the left column first. Then slide your finger across until you hit the column that matches your weight. The number where they meet is your BMI.
Most charts use colors to make the categories pop. Green usually means healthy weight, yellow for overweight, and red or darker shades for obesity ranges. This color coding makes the whole thing easier to scan.
Don’t overthink the reading part. It’s just matching two numbers on a grid. Once you do it a couple of times, it becomes second nature.
Printing Your Chart: Best Sizes and Paper to Use
For printing, stick with standard letter size paper. 8.5 by 11 inches works perfectly and fits just about any home printer or office copier.
Use decent quality paper if you can. Nothing fancy, but something a little thicker than flimsy will hold up better over time, especially if you’re going to pin it up or pass it around.
If you’re a health care provider or trainer who wants something more polished, that high-resolution CDC version can be professionally printed with a 4-color process for a clean, poster-quality result.
Some folks laminate their printed BMI chart so it doesn’t get torn or coffee-stained. This is a smart idea if you plan to keep it in a busy kitchen or gym area.
The whole point of having this chart printed is that it’s always within reach. No logging in, no updating apps, no remembering passwords. Just glance and go.
Whether you’re tracking your own numbers or helping family members stay on top of their health, a printed chart makes the whole process feel less like a chore and more like a quick check-in.
And hey, if you’re also keeping an eye on physical activity levels or other health habits, having the chart nearby can be a nice little nudge to stay consistent.
Keep Your BMI Chart Printable Close—A Handy Health Check at Your Fingertips
Sometimes, you just want a quick way to check your weight without any fuss. Having a BMI chart nearby makes that super easy. You can glance at it whenever you’re curious, without needing an appointment or a device.
Try our BMI Calculator 👉
For adults, the process is straightforward. Your height and weight give you a number that fits into a category. But remember, this number is just a starting point. Real health assessments look at more than just one number. Things like skin fold measurements, diet, and physical activity all matter.
For children and teens, the conversation shifts to percentiles, which compare their growth to others their age. A single percentile reading isn’t the whole story. Kids grow and change, and their health journey is unique.
Whether you’re keeping an eye on your own health or your child’s, this chart is just a tool. It doesn’t define anyone’s worth. Pair it with good nutrition and regular activity, and you’ve got a solid foundation for health.
So, tuck that printed chart somewhere you’ll see it often. Remember, health isn’t about perfection. It’s about making small choices that add up.